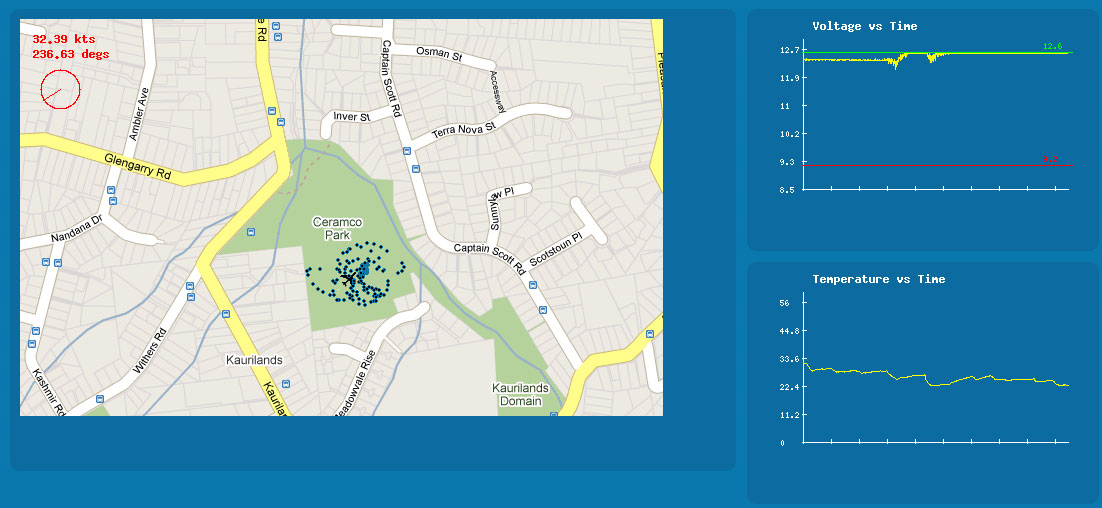
Here it is! On this screenshot we have plotted the data taken from the recent test flight of the Mark II. The dots on the map show the position of the plane every second and the graphs on the side are taken from the voltage and temperature sensors on board.
It was too windy for a test flight today but we will try and take out the Mark II tomorrow to test the interface. Tomorrow we will also be having a company meeting so expect another update soon.

